Desmos 3D: Voronoi Cobblestone
And some other cool facts about this kind of pattern!
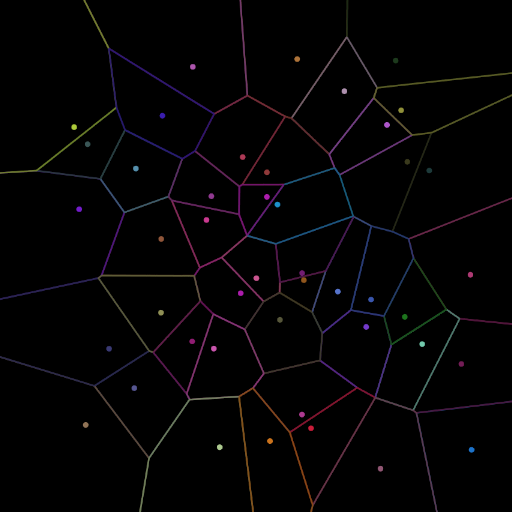
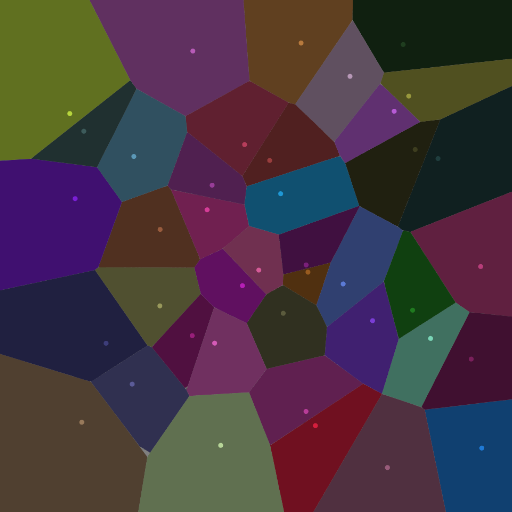
Imagine scattering some colored marbles onto a large sheet of paper. After that, color each point on the paper the same color as the nearest marble. Once your paper is completely colored, you will have a Voronoi diagram.
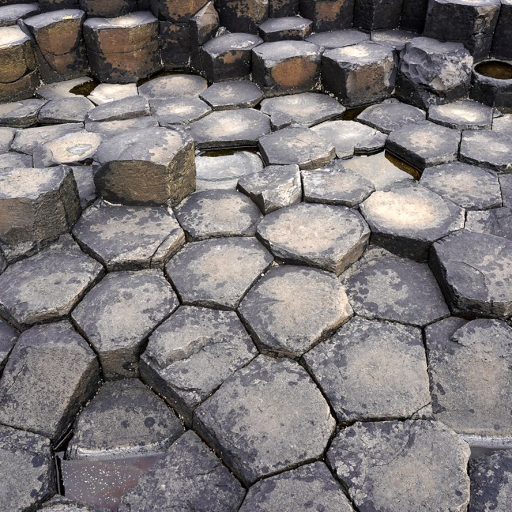
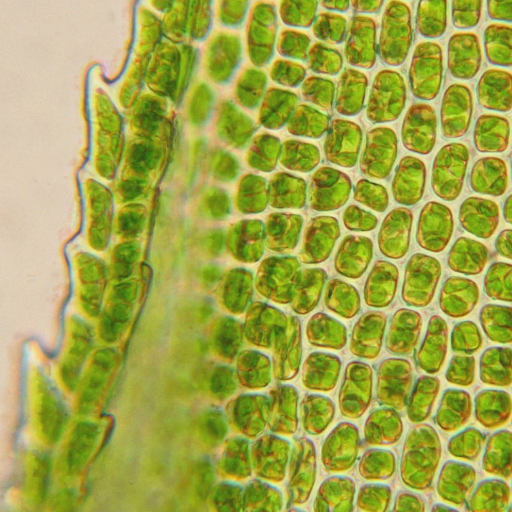
Many related structures exist in nature, and typically emerge wherever "cell-like" activity is present:


Perfectly straight boundaries actually posed two different problems, depending on how I implemented them:
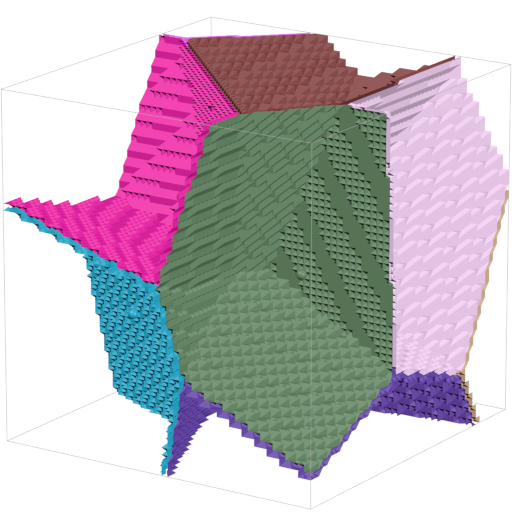
The first thing I tried was asking the calculator to show surfaces where across the distances between the current pixel and each marble,
the minimum of that was equal to the distance between the current pixel and current marble:
As you can see, in 3D, the boundaries end up a mess for some reason. It probably has something to do with how Desmos 3D infers surface normals, but I'm not really qualified to speculate on that since I don't know how it works.
As you can see, in 3D, the boundaries end up a mess for some reason. It probably has something to do with how Desmos 3D infers surface normals, but I'm not really qualified to speculate on that since I don't know how it works.
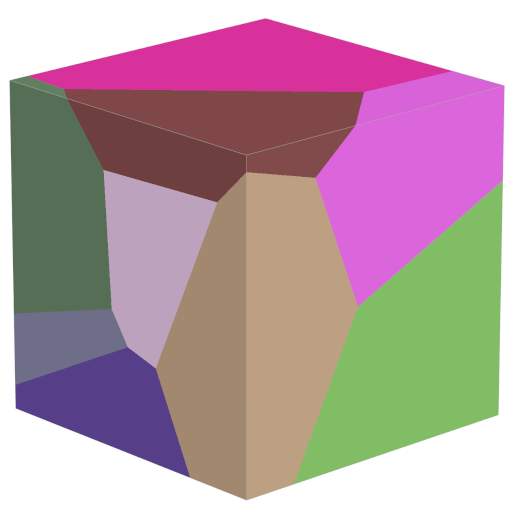
The second method was basically the same as the first, except I asked the calculator to fill entire regions instead of
just locating surfaces:
While this did clear up the distorted surfaces, it created an entirely different problem: in 3D, it's solid and you can't see inside it. And since we aren't four-dimensional, there's literally no hope of ever perceiving the entire cube and its insides at once. So this approach doesn't work either.
While this did clear up the distorted surfaces, it created an entirely different problem: in 3D, it's solid and you can't see inside it. And since we aren't four-dimensional, there's literally no hope of ever perceiving the entire cube and its insides at once. So this approach doesn't work either.
The examples shown in nature aren't perfect either!
